XAUUSD Sell at 4003: Latest News
Gold (XAU/USD) experienced a record-breaking single-day drop, sliding from $4,381 to $4,003 in just 36 hours due to market volatility and profit-taking after a historic rally. Despite hitting this key psychological level, gold managed an intraday bounce, but technical signals reveal critical risks for bearish traders should price slip below $4,003. The volatility is being fueled by global economic uncertainty, central bank rate cuts, and risk-on sentiment, which are driving rapid reversals and speculative trading.
Technical Analysis
The $4,000 mark acts as a strong psychological and technical support. If gold closes beneath this level, expect further bearish momentum down to the next Fibonacci retracements at $3,948, with possible extensions toward $3,800.
Resistance zones are found at $4,100–$4,128 where short covering may trigger a bounce.
Oscillators and moving averages suggest cautious positioning; further breakdown below $4,003 could accelerate sell-offs.
Selling Strategies
Use stop-loss orders below $4,003 to minimize downside risk.
Monitor supply and demand zones closely for short entry confirmations.
Risk management is crucial: only trade if gold decisively closes beneath $4,003 and avoid low-volume, highly volatile periods.
Keep updated with global news and Federal Reserve announcements, as macro events may trigger reversal spikes.
Conclusion
Gold’s plunge to $4,003 has opened new trading opportunities but also heightened risk. Any decisive move below this level should be watched closely, with strategic sells targeting secondary support and strict risk controls. Stay alert to news, technical signals, and market sentiment to navigate this volatile environment.
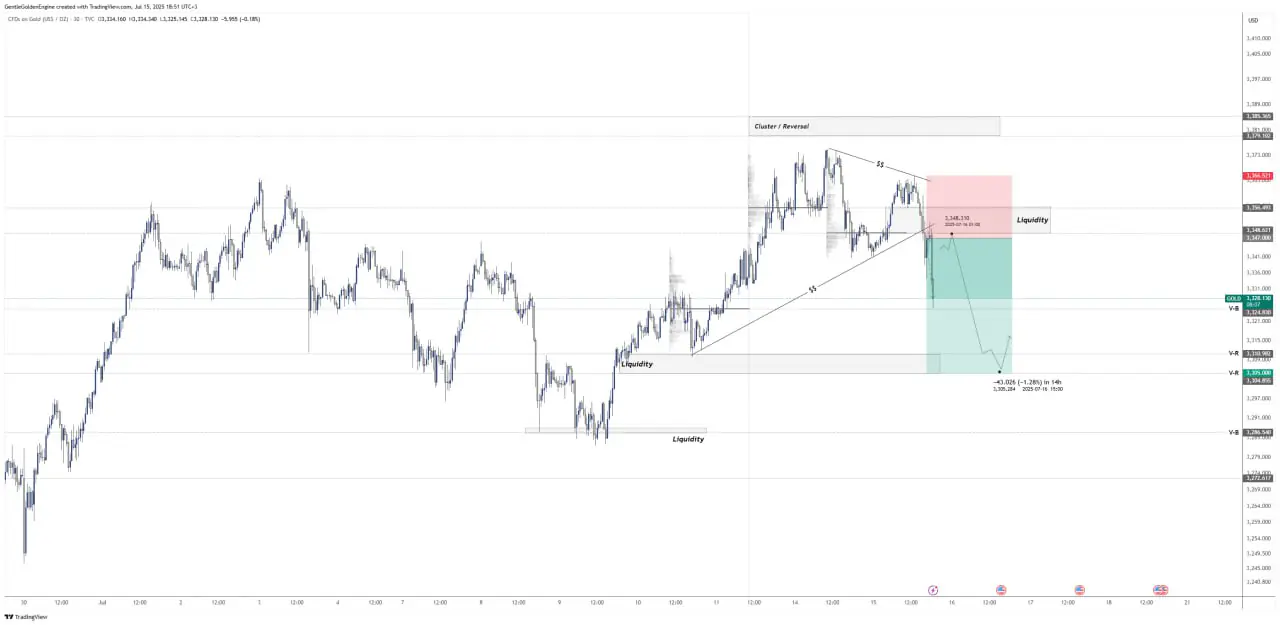
The sharp price drop to the 4003 level, typically highlighted in red on candlestick or line charts, is a focal visual illustrating recent volatility.
Mark critical support and resistance zones, such as the horizontal lines at 4000 (support) and near 4100 or 4300 (recent highs) to add context for trading decisions.
Annotate trend arrows to show the direction of price moves and reversal points during the latest selloff.
Consider adding overlay labels to highlight key events, such as the largest one-day drop or periods of intense volume corresponding to the news.